
How Shot Mix Changes the Meaning of a Goalkeeper’s Save Percentage
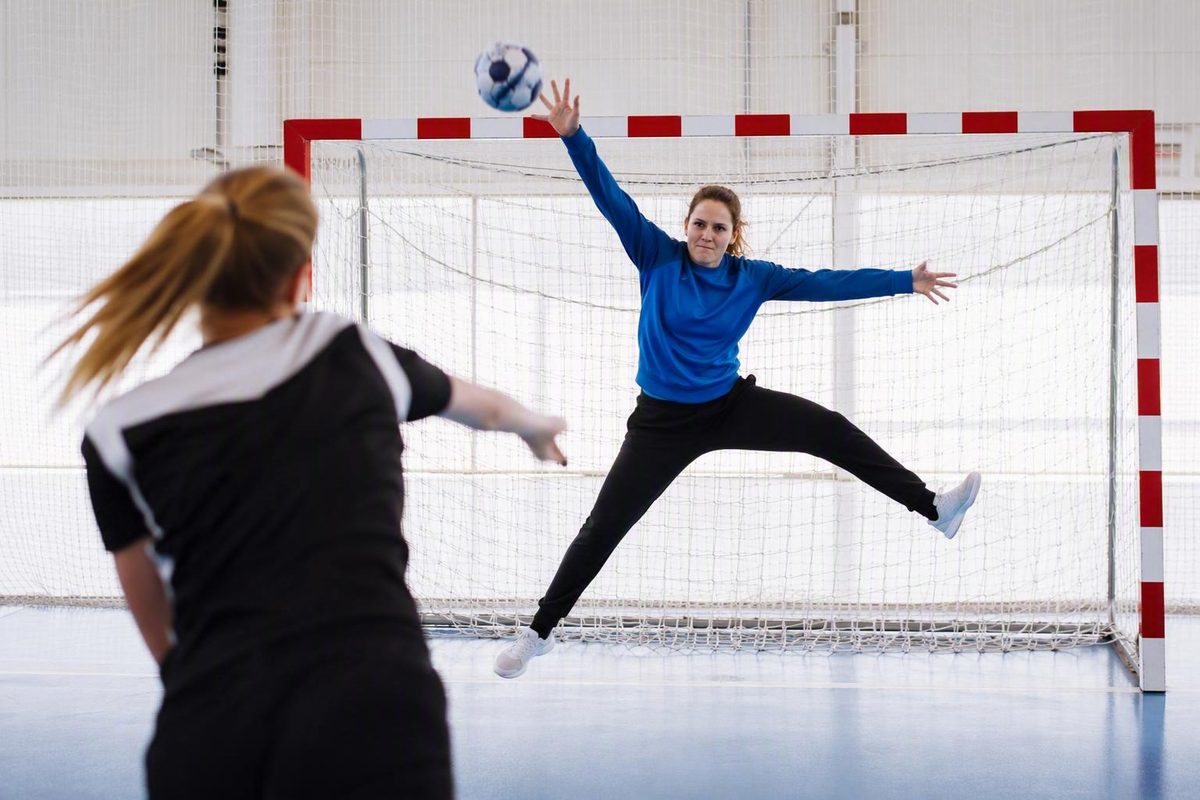
Calculate each category from saves and shots on target, publish the counts, and see how shot mix can change the overall rate without changing location rates.
A handball goalkeeper’s save percentage should be calculated as saves divided by shots on target faced, multiplied by 100. For a meaningful shot-location analysis, apply that formula separately to consistently defined categories and publish the underlying saves and attempts.
The overall percentage is a weighted summary of those category results. It can therefore rise or fall because the goalkeeper faces a different distribution of shots—even when the modeled save rate within every category remains unchanged.
The quick answer: calculate save percentage within each shot category
For this guide, the denominator convention is:
Save percentage = (saves ÷ shots on target faced) × 100
When every recorded attempt in the dataset is on target:
Shots faced = saves + goals conceded
This is a reporting convention, not an assumption that every data provider defines “shots faced” identically. Before comparing datasets, verify whether blocked shots, off-target attempts, empty-goal attempts, or other outcomes are included. Do not change conventions midway through an analysis.
Calculate the percentage independently for each compatible category. If a goalkeeper saves 8 of 20 distance shots, the category rate is 40%. Do not combine those attempts with close-range or penalty shots until calculating the overall total.
A compact reporting template keeps each percentage attached to its workload and context:
| Category definition | Workload and outcome | Save percentage | Qualification and context |
|---|---|---|---|
| Close-range zone | Shots: ; saves: ; goals: __ | __ | Minimum: __; game state: __ |
| Wing zone | Shots: ; saves: ; goals: __ | __ | Minimum: __; game state: __ |
| Distance zone | Shots: ; saves: ; goals: __ | __ | Minimum: __; game state: __ |
| Transition situation | Shots: ; saves: ; goals: __ | __ | Minimum: __; game state: __ |
| Penalty situation | Shots: ; saves: ; goals: __ | __ | Minimum: __; game state: __ |
The category definition must say exactly what qualifies for the row. If “transition” overlaps with the court-zone categories, it should be stored as a separate analytical field rather than treated as another mutually exclusive location.
Counts matter because percentages alone conceal sample size. Two saves from seven attempts and 20 saves from 70 attempts produce similar rates, but the larger workload provides substantially more evidence about the observed result.
Separate location, distance, shot type, and attacking situation
Useful breakdowns may include:
- close-range or 6 m attempts;
- wing attempts;
- distance or 9 m attempts;
- fast-break or other transition attempts;
- in-flight finishes; and
- 6 m penalties.
These labels do not all describe the same dimension. Analysts should distinguish among:
- Court origin: where the attempt began.
- Shooting distance: how far the shooter was from goal.
- Angle: the width or direction of the shooting lane.
- Shot technique: for example, an in-flight finish or spinshot.
- Attacking situation: settled attack, breakthrough, transition, or penalty.
- Goal-mouth target zone: where the ball was directed.
A true shot-location analysis requires event coordinates or consistently defined court zones. A central close-range shot and a wing shot might begin at similar distances while presenting very different angles. Two attempts from the same zone may also differ because one follows a settled attack under pressure and the other is an uncontested fast break.
Categories must therefore be declared mutually exclusive before they are added together. One workable design is to use court zone as the primary category while storing distance, technique, attacking situation, and target zone in separate fields. Analysts can then filter or cross-tabulate those variables without counting one attempt in multiple rows of an overall total.
Broad labels such as “special 6 m,” “in-flight,” or “spinshot” should not be presented as coordinates or converted into a precise heatmap. They may support a shot-type or situational breakdown, but they do not establish exactly where each shot originated.
The Men’s EHF EURO 2026 qualitative analysis treats attack situations, shot locations, and goalkeeper outcomes as distinct parts of tournament analysis. That structure illustrates why comparisons need aligned categories, denominators, and game states rather than one loosely defined “position” variable.
Worked example: how shot mix moves the overall percentage
Every number in this section is hypothetical. None represents observed handball data or a benchmark for goalkeeper ability.
Assume a goalkeeper has these fixed modeled rates:
- 20% from close range;
- 30% from the wing; and
- 40% from distance.
First, assign a close-range-heavy workload:
| Category | Shots faced | Assumed rate | Saves |
|---|---|---|---|
| Close range | 50 | 20% | 10 |
| Wing | 30 | 30% | 9 |
| Distance | 20 | 40% | 8 |
| Total | 100 | 27% overall | 27 |
Now reverse the balance between close-range and distance attempts:
| Category | Shots faced | Assumed rate | Saves |
|---|---|---|---|
| Close range | 20 | 20% | 4 |
| Wing | 30 | 30% | 9 |
| Distance | 50 | 40% | 20 |
| Total | 100 | 33% overall | 33 |
The assumed category rates did not change. Only the distribution of attempts changed, yet the overall percentage rose from 27% to 33%.
The reverse problem is also possible: two goalkeepers can record the same overall percentage while producing different category profiles. The following comparison is also entirely hypothetical:
| Goalkeeper | Close range | Wing | Distance |
|---|---|---|---|
| A | 20/50 | 5/20 | 5/30 |
| B | 5/25 | 10/25 | 15/50 |
Each goalkeeper finishes with 30 saves from 100 shots, or 30%. The overall figure cannot show that their results were distributed differently across the three categories. It also cannot establish why those differences occurred.
What the available tournament figures show—and do not show
Tournament statistics can demonstrate the correct reporting principle when they pair every percentage with saves, shots faced, category definitions, and qualification thresholds. They can distinguish, for example, between the goalkeeper with the highest recorded rate and the goalkeeper who made the most saves. Those are separate outcomes because efficiency and workload are not the same measurement.
However, named-player figures should not be reproduced as publication-grade evidence unless the original dataset is traceable and its context can be audited. At minimum, readers need to know:
- the competition and handball discipline;
- the publisher and original source location;
- the event dates and match set;
- the participant category;
- the definitions of each shot category;
- the denominator and data-collection rules;
- the minimum-attempt thresholds; and
- whether the records were validated.
This context is particularly important when category labels could describe a handball variant, a specialized competition, a technique, or a scoring rule rather than a conventional indoor-handball location. Results from “spinshots,” “one-pointers,” “in-flight” attempts, or “special 6 m” attempts cannot automatically be combined with ordinary close-range, wing, and distance categories.
A sound tournament table would use a structure such as:
| Category and goalkeeper | Saves/shots | Save rate | Minimum attempts |
|---|---|---|---|
| Overall | __ / __ | __ | __ |
| Defined court zone | __ / __ | __ | __ |
| Defined shot type | __ / __ | __ | __ |
| Defined situation | __ / __ | __ | __ |
Even a properly sourced table would describe only the observed competition sample. It would not establish a general handball benchmark or prove that the percentage leader was the most skilled goalkeeper. A high rate over seven attempts, for example, remains a small-sample observation rather than evidence of stable performance.
The absence of qualifying entries in a category also has a narrow meaning. It may reflect the source’s minimum-attempt rule or the composition of the match sample; it does not establish how goalkeepers generally perform against that type of shot.
A checklist for fair goalkeeper comparisons
Before ranking two goalkeepers, check the following:
- Category definitions match. A broad 6 m group should not be compared directly with a narrower category covering only a particular 6 m technique or situation.
- Categories are mutually exclusive when aggregated. If location, technique, and attack situation overlap, retain them as separate fields.
- Denominator rules match. Confirm that “shots faced” has the same meaning in both datasets.
- Counts accompany percentages. Show shots, saves, and preferably goals conceded so efficiency is not confused with workload.
- Qualification thresholds match. Apply one minimum-attempt rule or disclose differences clearly.
- Attacking situations align. Separate settled attacks, transitions, breakthroughs, in-flight attempts, and penalties where the data permit.
- Game states are comparable. Numerical strength, score state, and related conditions may change the difficulty of nominally similar shots.
- Competition and period align. Do not assume rates transfer unchanged across leagues, tournaments, age categories, competitive levels, disciplines, or eras.
- Small samples receive cautious treatment. A category percentage based on a handful of attempts is a volatile result, not a stable estimate of ability.
- The source is auditable. Category definitions, provenance, and collection methods should be available before numerical rankings are published.
A simple decision table helps prevent overclaiming:
| Data condition | Comparison decision |
|---|---|
| Matching categories, contexts, denominators, and thresholds | Make a cautious descriptive comparison |
| Different contexts or qualification thresholds | Compare only with explicit qualification |
| Mismatched or overlapping category definitions | Do not rank the rates directly |
| Missing definitions, unclear provenance, or tiny samples | Do not use the figures to rank ability |
Tournament totals are descriptive. On their own, they cannot isolate goalkeeper skill, demonstrate tactical causation, or establish how much a goalkeeper contributed to winning.
From raw percentage to a shot-adjusted goalkeeper metric
Analysts can reduce shot-mix distortion by establishing a common baseline save rate for every consistently defined category.
If n_i is the number of shots a goalkeeper faces in category i, and p_i is the credible baseline save rate for that category, then:
Expected saves = Σ (shots faced in category × category baseline rate)
The difference between recorded and expected performance is:
Saves above expected = actual saves − expected saves
Suppose a goalkeeper faces an unusually large share of attempts from categories with low baseline save rates. The raw overall percentage could be lower than that of a goalkeeper who faced a more favorable distribution. Expected saves would evaluate each workload against the same set of category baselines.
An alternative is direct standardization. Apply each goalkeeper’s category-specific rates to one shared reference distribution of close-range, wing, distance, transition, and penalty attempts. The result is a standardized save rate or expected save total under the reference mix—not a prediction of a match score.
Both methods can reduce distortion from shot distribution, but their quality depends on the categories and baselines. Neither method automatically controls for:
- precise shooting angle;
- defensive pressure;
- target placement;
- shot technique;
- attack type;
- numerical strength or score state;
- shooter quality; or
- recording and classification errors.
A measured expected-saves result should not be calculated without credible competition-wide or league-wide baselines built from compatible data. Hypothetical rates can explain the method, but they must remain clearly separated from observed results.
Limitations: what these numbers cannot establish
Even a correctly calculated category percentage remains an aggregate outcome. It cannot independently separate goalkeeper technique from shot quality, defensive pressure, shooting angle, target placement, attacking situation, or game state. More detailed event data can improve that analysis, but a category label alone does not remove context.
Qualification thresholds also affect which players appear in a ranking. Different minimums across categories make leaders difficult to compare, while very small workloads produce unstable percentages. Transparent definitions and counts are therefore essential.
Some supporters perceive changing shot distances and fewer traditional long-range saves, as illustrated by this community discussion about handball trends. Those comments are fan perceptions, not evidence of a historical change. Testing such a claim would require multi-season, event-level data collected under consistent shot definitions.
Universal labels such as “good” or “world-class” should also be avoided when no supported cross-level benchmark is available. Fair evaluation requires compatible shot categories, published attempts and saves, aligned contexts and thresholds, and cautious treatment of small samples. Shot-adjusted analysis can improve comparisons only when it uses transparent categories and a credible common baseline.