
The Five Players Behind Nykøbing’s 31-Goal Champions League Win
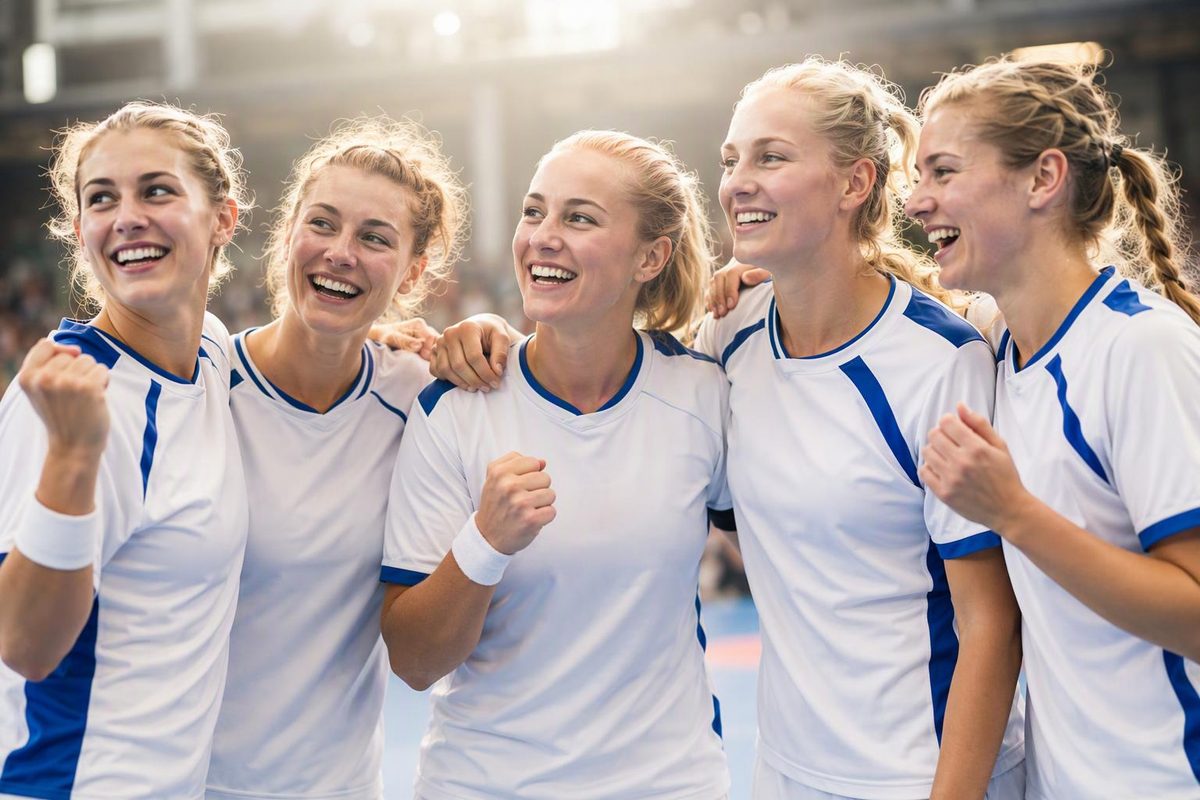
See the five scorers behind Nykøbing’s 31:26 win over Blomberg-Lippe, with goals, shooting rates, the half-time split and Clara Lerby’s season context.
Nykøbing Falster’s five scorers in their 31:26 Champions League win over HSG Blomberg-Lippe were Clara Lerby, Moa Högdahl Schønningsen, Mia Solberg Svele, Maja Magnussen and Nanna Hinnerfeldt Andersen. Lerby scored nine, Högdahl eight, Svele six, Magnussen five and Andersen three. The home victory on 20 September 2026, in round three, was Nykøbing’s first win of the EHF Champions League Women 2026/27 season. The five-player count applies to this match, not the club’s entire European campaign. EHF match review
Choose a scorer to compare her goals and shooting rate with the five-player breakdown.
Compare The Five Scorers
Clara Lerby
9 goals from 10 shots
90.0% shooting; Nykøbing team rate: 66.0%.
| Scorer | Goals | Shots | Rate |
|---|---|---|---|
| Clara Lerby | 9 | 10 | 90.0% |
| Moa Högdahl Schønningsen | 8 | 12 | 66.7% |
| Mia Solberg Svele | 6 | 9 | 66.7% |
| Maja Magnussen | 5 | 9 | 55.6% |
| Nanna Hinnerfeldt Andersen | 3 | 4 | 75.0% |
Nykøbing 31:26 Blomberg-Lippe. These five players scored all 31 goals. Their rows cover 44 shots; the team recorded 47. Shooting rate is goals divided by shots, not goals per possession.
Source: EHF official match statistics, 20 September 2026. Rates calculated from recorded goals and shots.
The Five Scorers Accounted For All 31 Goals
The official match statistics give the following breakdown. Shooting percentage means goals divided by recorded shot attempts, multiplied by 100. It measures conversion of shots, not the percentage of attacks that ended in a goal.
| Nykøbing Scorer | Goals | Shots | Shooting Rate |
|---|---|---|---|
| Clara Lerby | 9 | 10 | 90.0% |
| Moa Högdahl Schønningsen | 8 | 12 | 66.7% |
| Mia Solberg Svele | 6 | 9 | 66.7% |
| Maja Magnussen | 5 | 9 | 55.6% |
| Nanna Hinnerfeldt Andersen | 3 | 4 | 75.0% |
Source: EHF official match statistics. Percentages calculated from the listed goals and shots.
Lerby led both in goals and in shooting percentage among these five scorers. Her nine goals came from ten attempts, so her leading total was not simply the result of taking the most shots. Högdahl took 12 attempts, the highest total in the group, and finished with eight goals.
Svele and Magnussen each recorded nine shots, but Svele scored six to Magnussen’s five. Their equal attempt totals make that particular comparison straightforward: the difference in goals also produced the difference between their 66.7% and 55.6% shooting rates.
Andersen had the smallest scoring total, with three goals, but converted 75.0% of her four attempts. That placed her below the others in goal volume while above everyone except Lerby in conversion. Those are different rankings, and both matter when describing how Nykøbing reached 31.
The table identifies every player who scored, rather than every player who attempted a shot. The five rows total 44 attempts, calculated from the individual figures, while the official team total was 47. Consequently, the five-scorer table should not be used as Nykøbing’s complete shooting ledger. It accounts for all the goals but not all the attempts.
Lerby And Högdahl Supplied More Than Half The Goals
Lerby and Högdahl combined for 17 of Nykøbing’s 31 goals, or 54.8% of the total. That is the clearest measure of the leading pair’s scoring contribution: more than half of the home side’s goals came from those two players.
Adding Svele and Magnussen brings the leading quartet to 28 goals, equivalent to 90.3% of Nykøbing’s scoring. Andersen’s three completed the total. These shares describe the distribution of goals within the winning team; they are not shooting percentages. The denominator is 31 team goals, rather than each player’s attempts.
The concentration was especially pronounced before Andersen joined the scoresheet. Högdahl, Lerby, Svele and Magnussen scored all 19 Nykøbing goals in the opening 40 minutes. Andersen then became the fifth scorer as the hosts extended their advantage. EHF match review
That sequence adds something the final table cannot show on its own. Nykøbing did not distribute the opening phase’s scoring across five players and then maintain the same pattern throughout. Four players supplied all their goals over the first 40 minutes, with the fifth scorer appearing later.
Neither the five-player total nor the quartet’s early dominance establishes how many teammates helped create those chances. A scorer count records who finished the attacks. It does not credit passes, screens, defensive work or other contributions that may precede a goal. The available figures support a concentrated finishing pattern, not a claim that only five players contributed to the win.
A 16:12 Second Half Turned A Narrow Lead Into A Clear Win
Nykøbing led 15:14 at half-time before finishing 31:26 ahead. Subtracting the interval scores from the final scores gives a 16:12 second half in the hosts’ favour. The second-half figures are calculated from the official score, rather than a separate scoring-rate measure. Official score and half-time result
| Period | Nykøbing | Blomberg-Lippe | Nykøbing Margin |
|---|---|---|---|
| First Half | 15 | 14 | +1 |
| Second Half | 16 | 12 | +4 |
| Full Match | 31 | 26 | +5 |
Nykøbing’s own output changed little between halves: 15 goals before the break and 16 afterwards. Blomberg-Lippe’s total fell from 14 to 12. Together, those changes explain how a one-goal interval lead became a five-goal final margin.
The distinction matters because the final score could otherwise suggest a substantial second-half scoring surge by Nykøbing. The hosts did score more after the break, but only slightly. The larger change in the half-by-half totals was the visitors scoring fewer goals.
Blomberg-Lippe had briefly taken the lead in the 21st minute, before Nykøbing recovered to lead at half-time. By the 40-minute stage, the hosts were three goals ahead. The visitors remained within reach without completing a comeback. EHF match review
Those checkpoints describe the direction of the match without supplying a complete minute-by-minute account. They show that Nykøbing recovered from a first-half deficit, entered the interval ahead and subsequently widened the lead. They do not establish that the margin grew continuously or that every spell of the second half favoured the hosts.
The half-time and final scores also cannot identify why Blomberg-Lippe’s scoring fell. Without a corresponding half-by-half shot or possession breakdown, the reduction cannot be assigned solely to fewer chances, poorer shooting or stronger goalkeeping. What the scoreboard establishes is the outcome: Nykøbing maintained their scoring output while the visitors finished the second half with fewer goals.
Shooting Efficiency Separated The Teams More Than Shot Volume
Nykøbing scored 31 goals from 47 attempts, a shooting rate of 66.0%. Blomberg-Lippe scored 26 from 49, or 53.1%. The hosts therefore won by five goals despite taking two fewer shots, with a conversion advantage of approximately 12.9 percentage points. EHF official match statistics
| Team | Goals | Shots | Shooting Rate |
|---|---|---|---|
| Nykøbing Falster | 31 | 47 | 66.0% |
| HSG Blomberg-Lippe | 26 | 49 | 53.1% |
This is a stronger explanation of the scoring gap than the number of Nykøbing players on the scoresheet. Five scorers can produce different team totals depending on how often they shoot and how successfully they convert. Here, the recorded attempts show that Nykøbing’s advantage did not come from a larger shot total.
The 12.9-point difference is a subtraction of the two rounded shooting percentages. It is a percentage-point gap, not a statement that Nykøbing scored 12.9% more goals. Keeping those terms separate avoids confusing conversion efficiency with the final-score difference.
Lerby’s 90.0% conversion stands out against Nykøbing’s 66.0% team figure. Andersen’s 75.0% also exceeded that team rate, while Högdahl and Svele each finished at 66.7%. Magnussen’s 55.6% was lower, although her five goals still formed part of the quartet that supplied 28 of the team’s 31.
Those comparisons should retain their attempt totals. Andersen’s rate came from four shots; Lerby’s came from ten. A higher percentage on a smaller number of attempts does not establish that a player would maintain that rate with a larger workload. The match figures describe what happened in this game, not a forecast of future shooting performance.
Nor are the team’s 47 and 49 attempts possession counts. A shooting comparison cannot, by itself, establish which side attacked faster or how frequently possessions ended without a shot. It also does not isolate shot difficulty or chance quality. The supported finding is narrower and clear: Nykøbing converted their recorded attempts more efficiently in this match.
Lerby Reached 29 Goals Through Three Matches
Lerby entered round three leading the tournament’s scoring chart with 20 goals after two matches. Her nine against Blomberg-Lippe brought her to 29 through Nykøbing’s first three games, a calculated average of 9.7 goals per match. EHF round-three preview
The timing of those figures matters. The 20-goal total and scoring-chart lead describe the position before round three. The 29-goal total describes Lerby’s accumulation after this match. It does not, on its own, establish her ranking after every other round-three fixture or her place on a later season leaderboard.
Her nine-goal performance against Blomberg-Lippe also came with the match-specific efficiency already shown: nine goals from ten attempts. The 9.7 season average measures scoring volume across three games, whereas the 90.0% shooting rate measures conversion in this single game. They answer different questions and should not be treated as interchangeable indicators.
The supplied figures do not include Lerby’s combined shot attempts across those first three matches. A three-match shooting percentage therefore cannot be calculated from this evidence. Carrying her 90.0% rate from the Blomberg-Lippe game across the opening three fixtures would misrepresent a one-match result as a season measure.
The defensible season-context statement is that she had already scored heavily before this win and added another nine goals to that opening total. Her 29 goals and 9.7-per-match average belong to the first three games, not to the full 2026/27 campaign.
The Victory Followed A Draw And A Defeat
Nykøbing opened their campaign with a 27:27 draw against Odense and then suffered a ten-goal defeat at Györ. The 31:26 result against Blomberg-Lippe was therefore their first win of the season, following those two opening fixtures. The EHF round-three preview and match review supply that campaign context.
The evidence here gives the exact Odense score but only the margin of the Györ defeat. It does not supply Györ’s full score, so that result cannot be reconstructed from the ten-goal margin alone. Likewise, these three match outcomes do not establish Nykøbing’s later group position or eventual qualification prospects.
For this round-three victory, the statistical explanation is more specific than “five players scored.” Lerby led with nine goals at 90.0% shooting, the top two supplied 54.8% of the goals, and the leading quartet supplied 90.3%. Across the team, Nykøbing scored more often from fewer attempts than Blomberg-Lippe. Those figures explain how a concentrated scoresheet produced a 31:26 win without turning one match into a claim about the entire season.